Do you want to know something about me? I’ll confess now that I’m a closet addict to Excel, spending numerous evenings just poking around the numbers, comparing data from one area to another, one period to another. I’m just trying to understand how the market forces shape our lives, command our decisions and control our checkbooks. In a free-market economy, one thing is for sure; nothing is for sure.
The last three months have been wild in real estate. Since the day the interest rates went up, and the stock market went down, the market has been steadily declining throughout the United States, including the west side of Los Angeles, to a degree we’re typically insulated from. But what does this mean for a data junkie like me?
Usually, I would grab five areas of the westside and pull up the data to compare days on the market, price/SqFt, Average price, or List price versus Selling price. However, this time, I decided to broaden the scope of my horizons and see how outlying areas of Los Angeles are performing under the dual pressures of lower stock portfolios and higher interest rates.
Economists will tell us that both factors dampen demand, likely resulting in inventory remaining on the market longer, buyers adjusting their budgets to fit the new loan figures, and sellers lowering their expectations in line with the latest market realities. We have now transformed from a seller’s market to a buyer’s market.
You’ll love this journey, comparing the months of June, July, and August in 2021 and 2022 for single-family homes only.
I looked at Beverly Hills, Pacific Palisades, El Segundo, Bell Gardens, Norwalk, Van Nuys, and Montebello. The data was massive, but I focused on the indicators that would provide a story about our economy and what happened in the last 90 days. This included:
- The number of closed escrows
- Average Days on Market
- Average Price
- Average Price/Sq Ft
- Average Price versus Original Listing Price
- Total Volume
Each data point has a different trigger in the process and can draw a picture of the buyer’s and seller’s frame of mind. Or at least give us a clue about what they might be thinking.
This is a crucial step in the negotiating process because the power of the negotiations leans towards those that can control the perception.


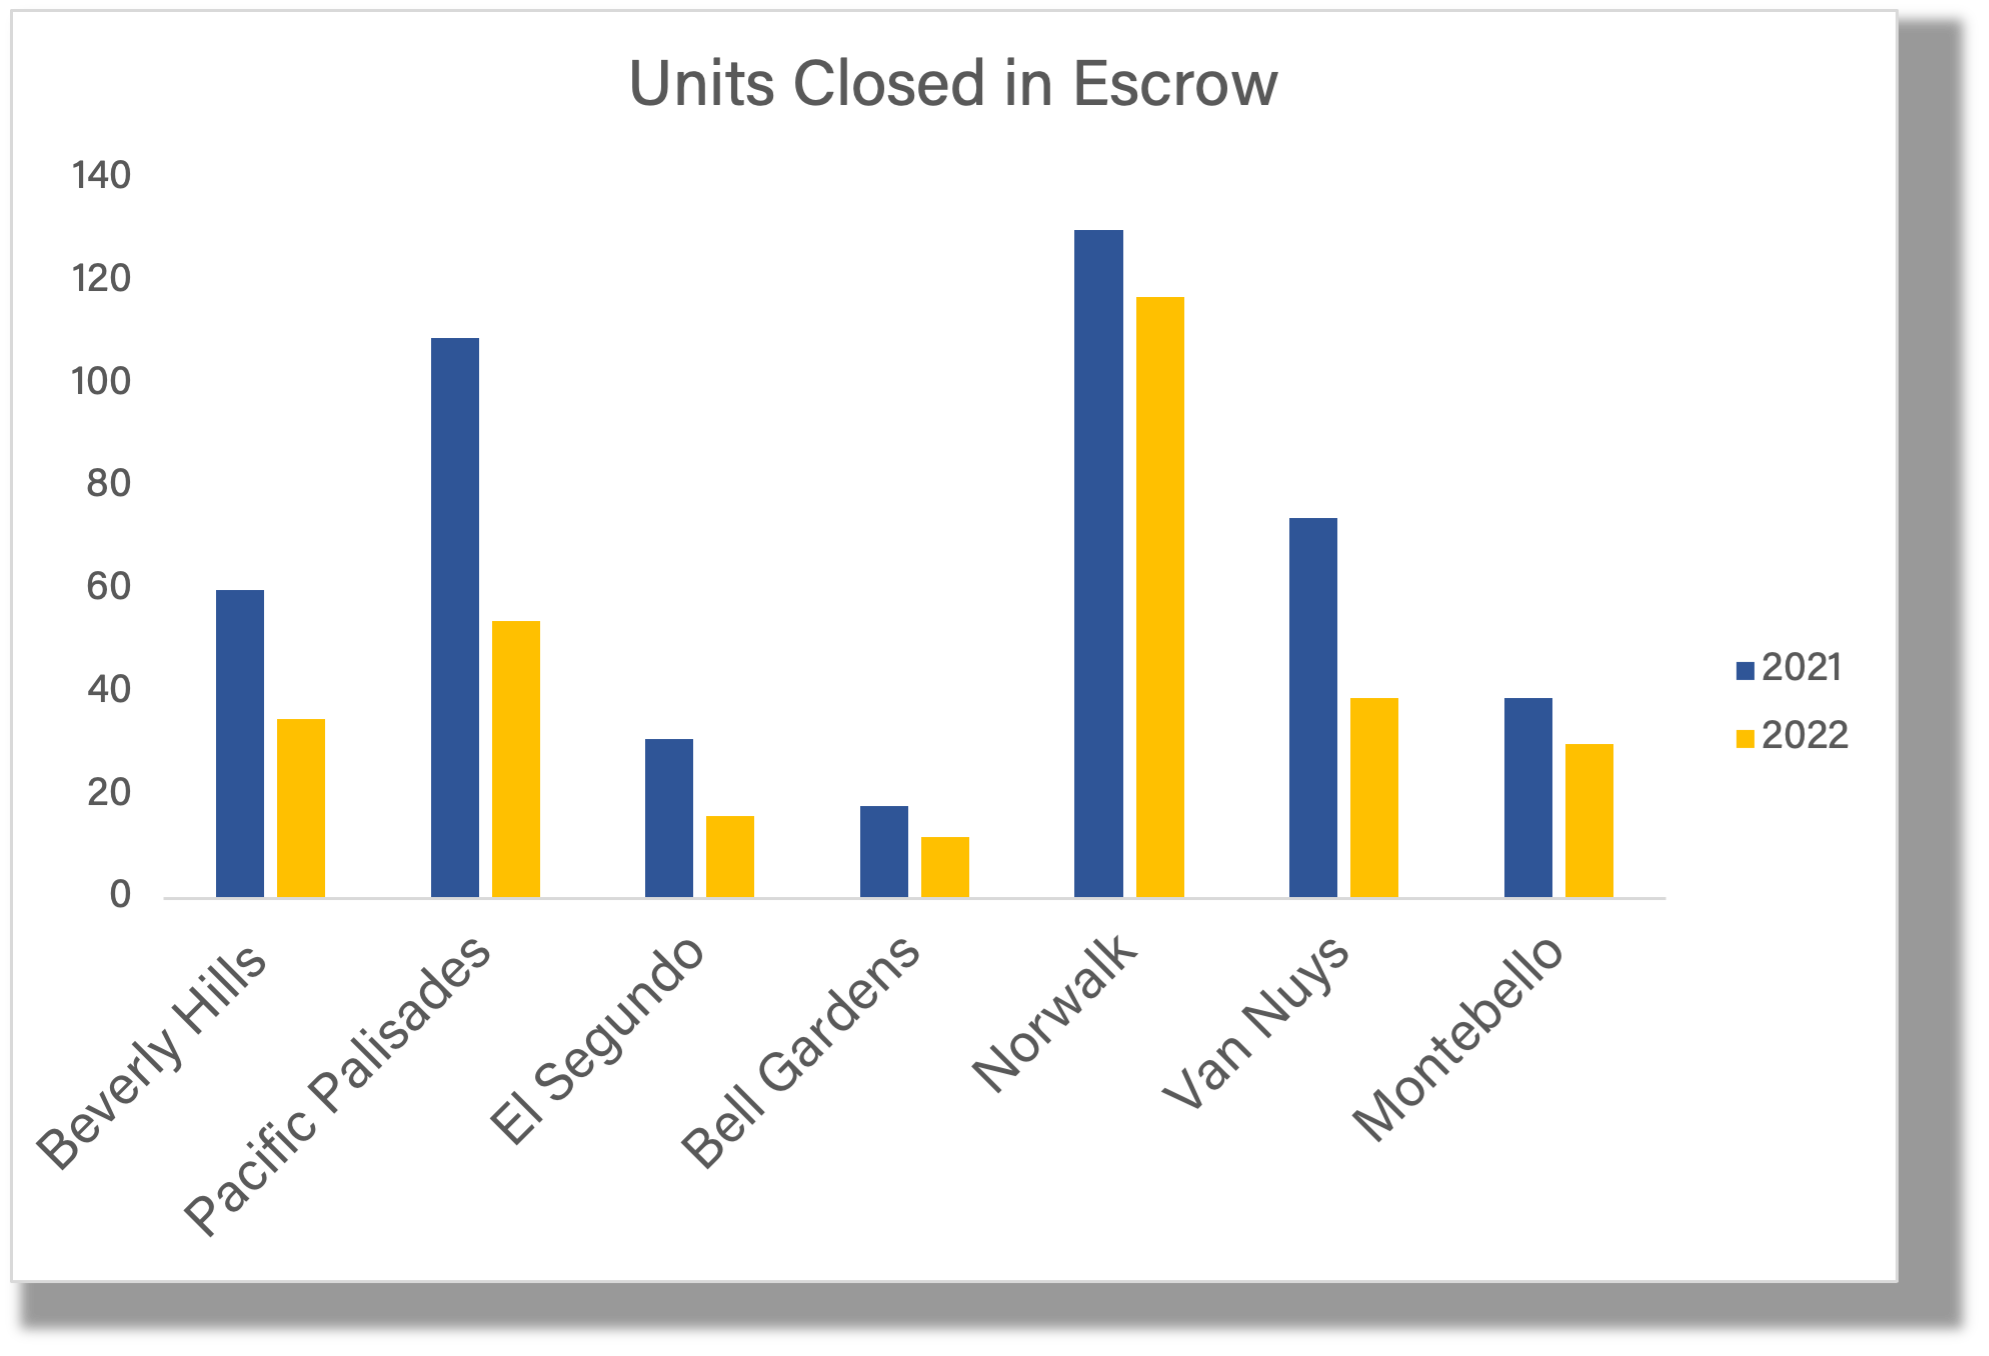
Closing dates for escrows are mainly because they display one frame of mind at the opening, and a different frame of mind at the close, especially when a major news event takes place, such as the rise in the Federal Reserve’s key interest rates or a sudden reverse in the stock market.
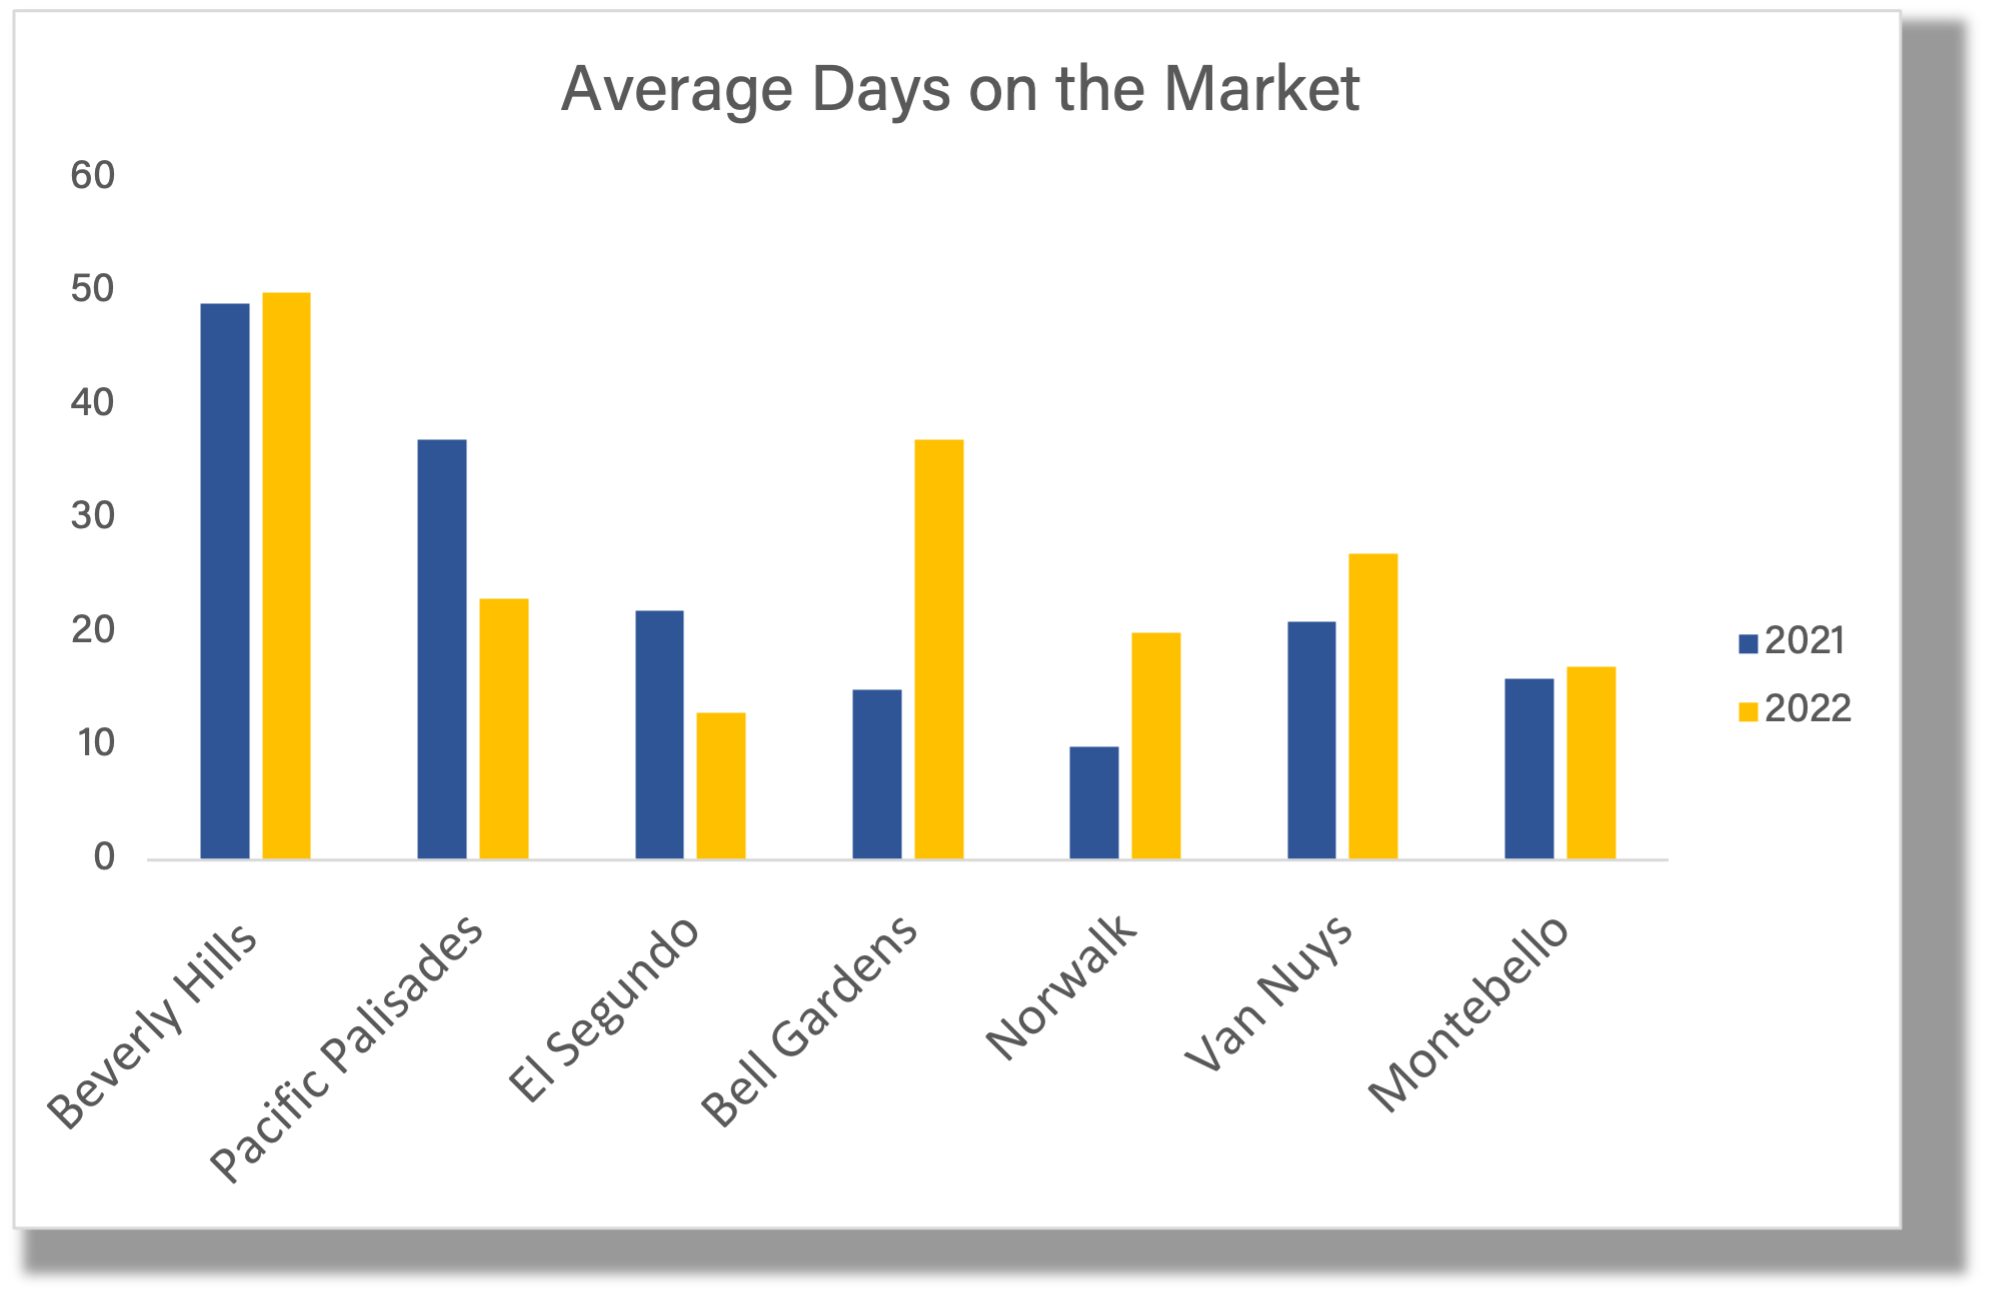
Average Days on the Market reflects the seller’s perception of the economy and when to hold them and fold them, as the song goes.
I love how actual closes ties into volume because it includes $/SqFt and opens a window to understand the behavior of two classes of buyers.
First is the buyer who must buy or the seller who must sell. They might be someone who inherited property, has a job transfer to a new city, is going through a divorce, or growing a family. These reasons all contribute to why real estate continues 365 days a year, regardless of what the gods of supply and demand are doing now.
The second class of buyers or sellers are those with no incentive to buy or sell. Maybe their investors feel the timing might suit higher rates or lower stock portfolios. Or perhaps they want to shift assets into something different to take advantage of their equity. Or possibly senior citizens who have come to the conclusion they need to trade their large single-family homes for the safety of a condominium. But, again, these are not compelling reasons that demand an immediate move into the market.
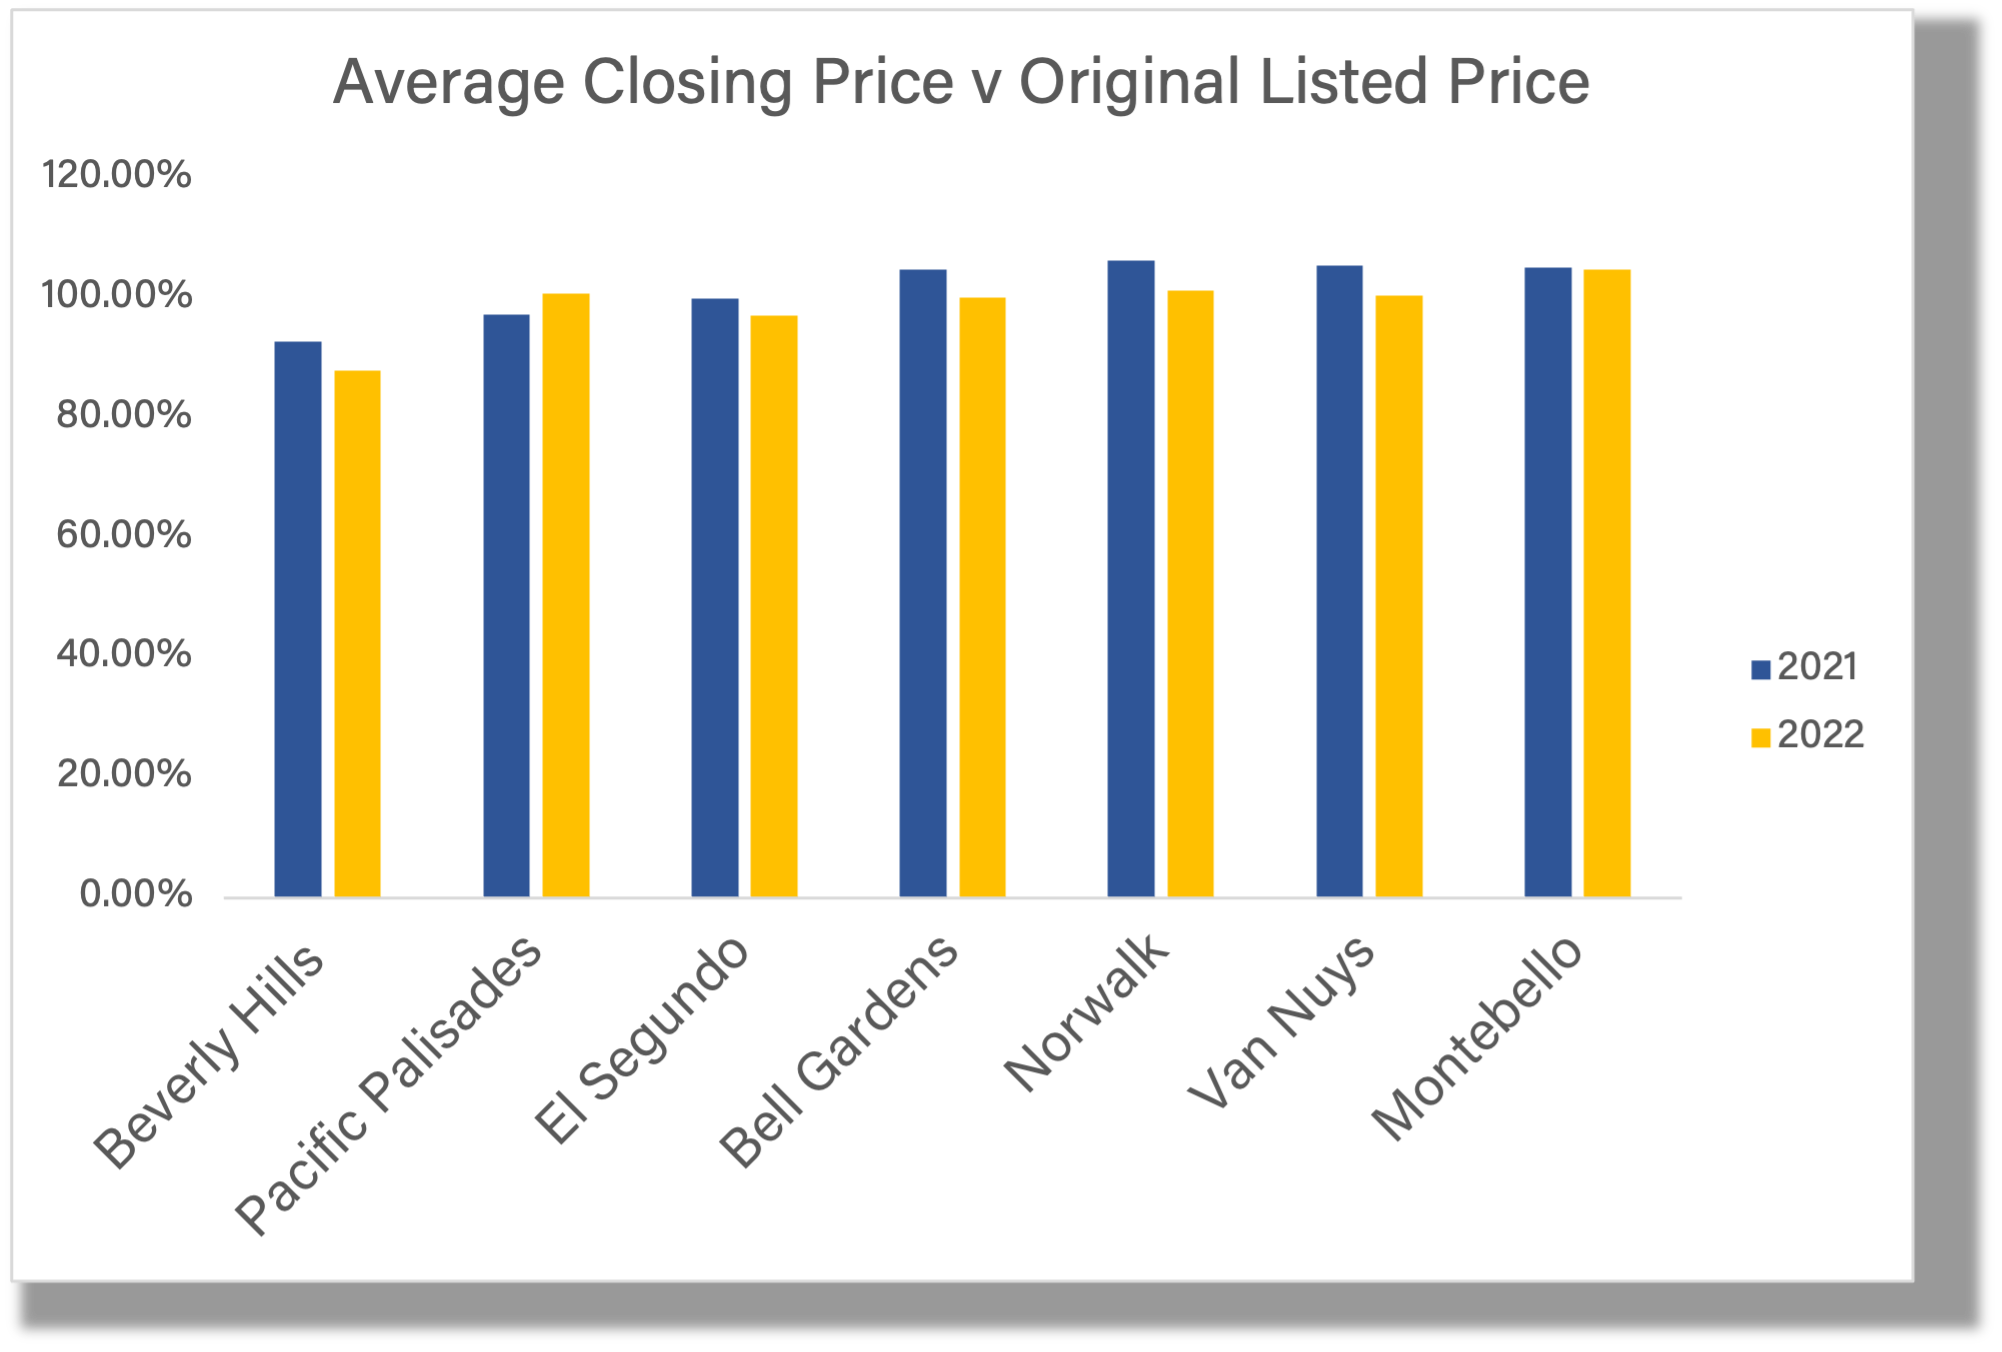
I was right. As I run these figures and generate the changes in percentages, it gives a clear and concise picture of the greater Los Angeles area. Across the board, actual closed sales fell, from a 50% drop in the Palisades to a 10% drop in Norwalk. On the other hand, average days on the market increased in five of the seven areas, from 2% in Beverly Hills to 147% in Bell Gardens and 100% in Norwalk. Six of the seven areas saw closing prices drop below their original listing prices but with tight ranges, from 95% in Norwalk and Van Nuys to exact pricing in Montebello. Only the Palisades showed an increase of 4%, indicating we were still not experiencing the dramatic declines reported in the rest of the country.
Remember, the effects of significant decreases in units can be reversed by an increase in Average Price/SqFt. And that data point increased across the board, from a low of 3% in Montebello to a high of 24% in El Segundo and 22% in Pacific Palisades.
What do we have here? A beautiful story written by two authors; supply and demand. They tell us that serious parties are the predominant market, leaving a lot of “undecideds” on the sidelines. Sellers are still driving a hard bargain, even if it means their days on the market are doubled, increasing their carrying costs. They haven’t accepted that they are not going to get the same money for their homes as their neighbors did just six months ago.
Third-party vendors, such as inspectors and escrow officers, see a massive difference in unit volume, so they are probably more flexible on pricing. Finally, with the Federal Reserve governors indicating their intent on reigning in the high inflation through increased lending rates in all parts of the economy, and the memory of the past three months, you can bet you’ll see more flexibility from the sellers and harder negotiating from the buyers. We can all see the trends very clearly.
A lot of people ask for my data. Email me, and I’ll send it to you. Stay safe, stay positive, and test negative.


