Real estate is a hot topic right now. I know this because my phone has been the busiest it’s ever been over the last six months.
We saw a surge in real estate transactions in January as buyers came forward to accelerate their plans before the future mortgage rate hikes. Likewise, sellers stepped up to the plate to sell at attractive terms. As a result, we closed a series of transactions in one quarter that almost equaled what we do in most years.
I’m exhausted, but all escrows are closed!
During this active time, the most commonly asked question is centered on timing, “When should I sell, when should I buy?”
What makes this question even more curious is the effect the two Federal Reserve rate hikes have had on the market. So, for the sake of knowledge, I decided to do some research to look for linear trends that might give us deeper market insight.
For this data deep dive, I’ve chosen a cross-section of four westside areas:
- Condos in the Wilshire Corridor in Westwood,
- Condos in the city of Beverly Hills,
- Houses in Brentwood, and
- Houses in Santa Monica.
All data represents closed transactions that have cleared escrow since January 1st, as reported on themls.com.
I want to point out that Real estate is a psychologically driven business fixated on neighborhoods. As a result, you’ll likely see different trends within the same city limits depending on the area. In addition, the asset type, condos, or houses, for example, will also affect transactions.
With that being said, let’s look at the data and the resulting graphs.


Wilshire Corridor Condos
Wilshire Corridor condos are our specialty and something we excel in. Therefore, one would think that decisions to buy or sell in February (closing 30-45 days later) might reflect the initial news reports of inflationary data and work their way through this data by showing up in March and April.
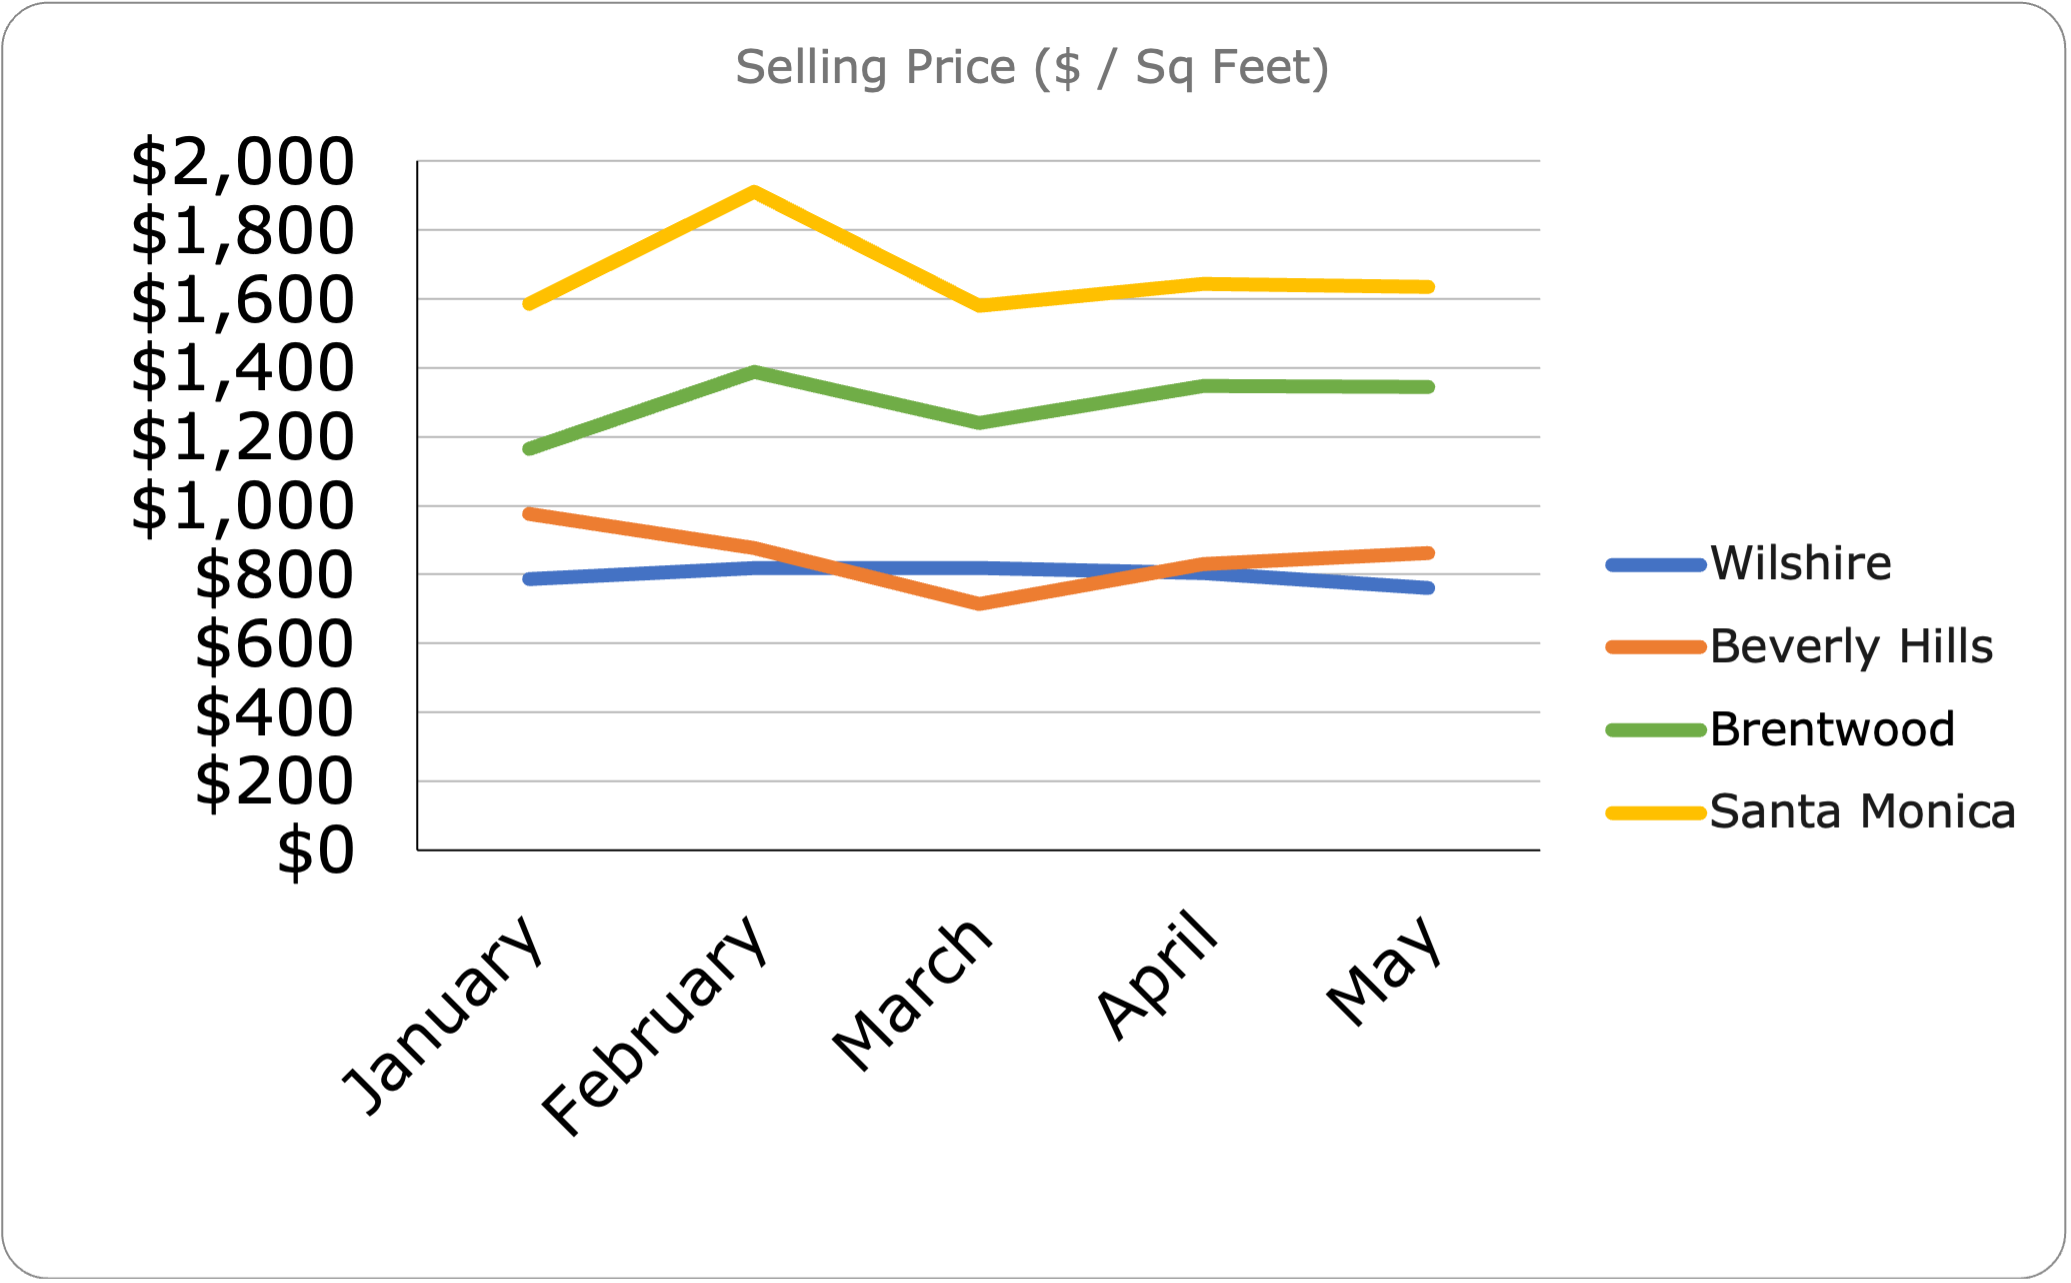
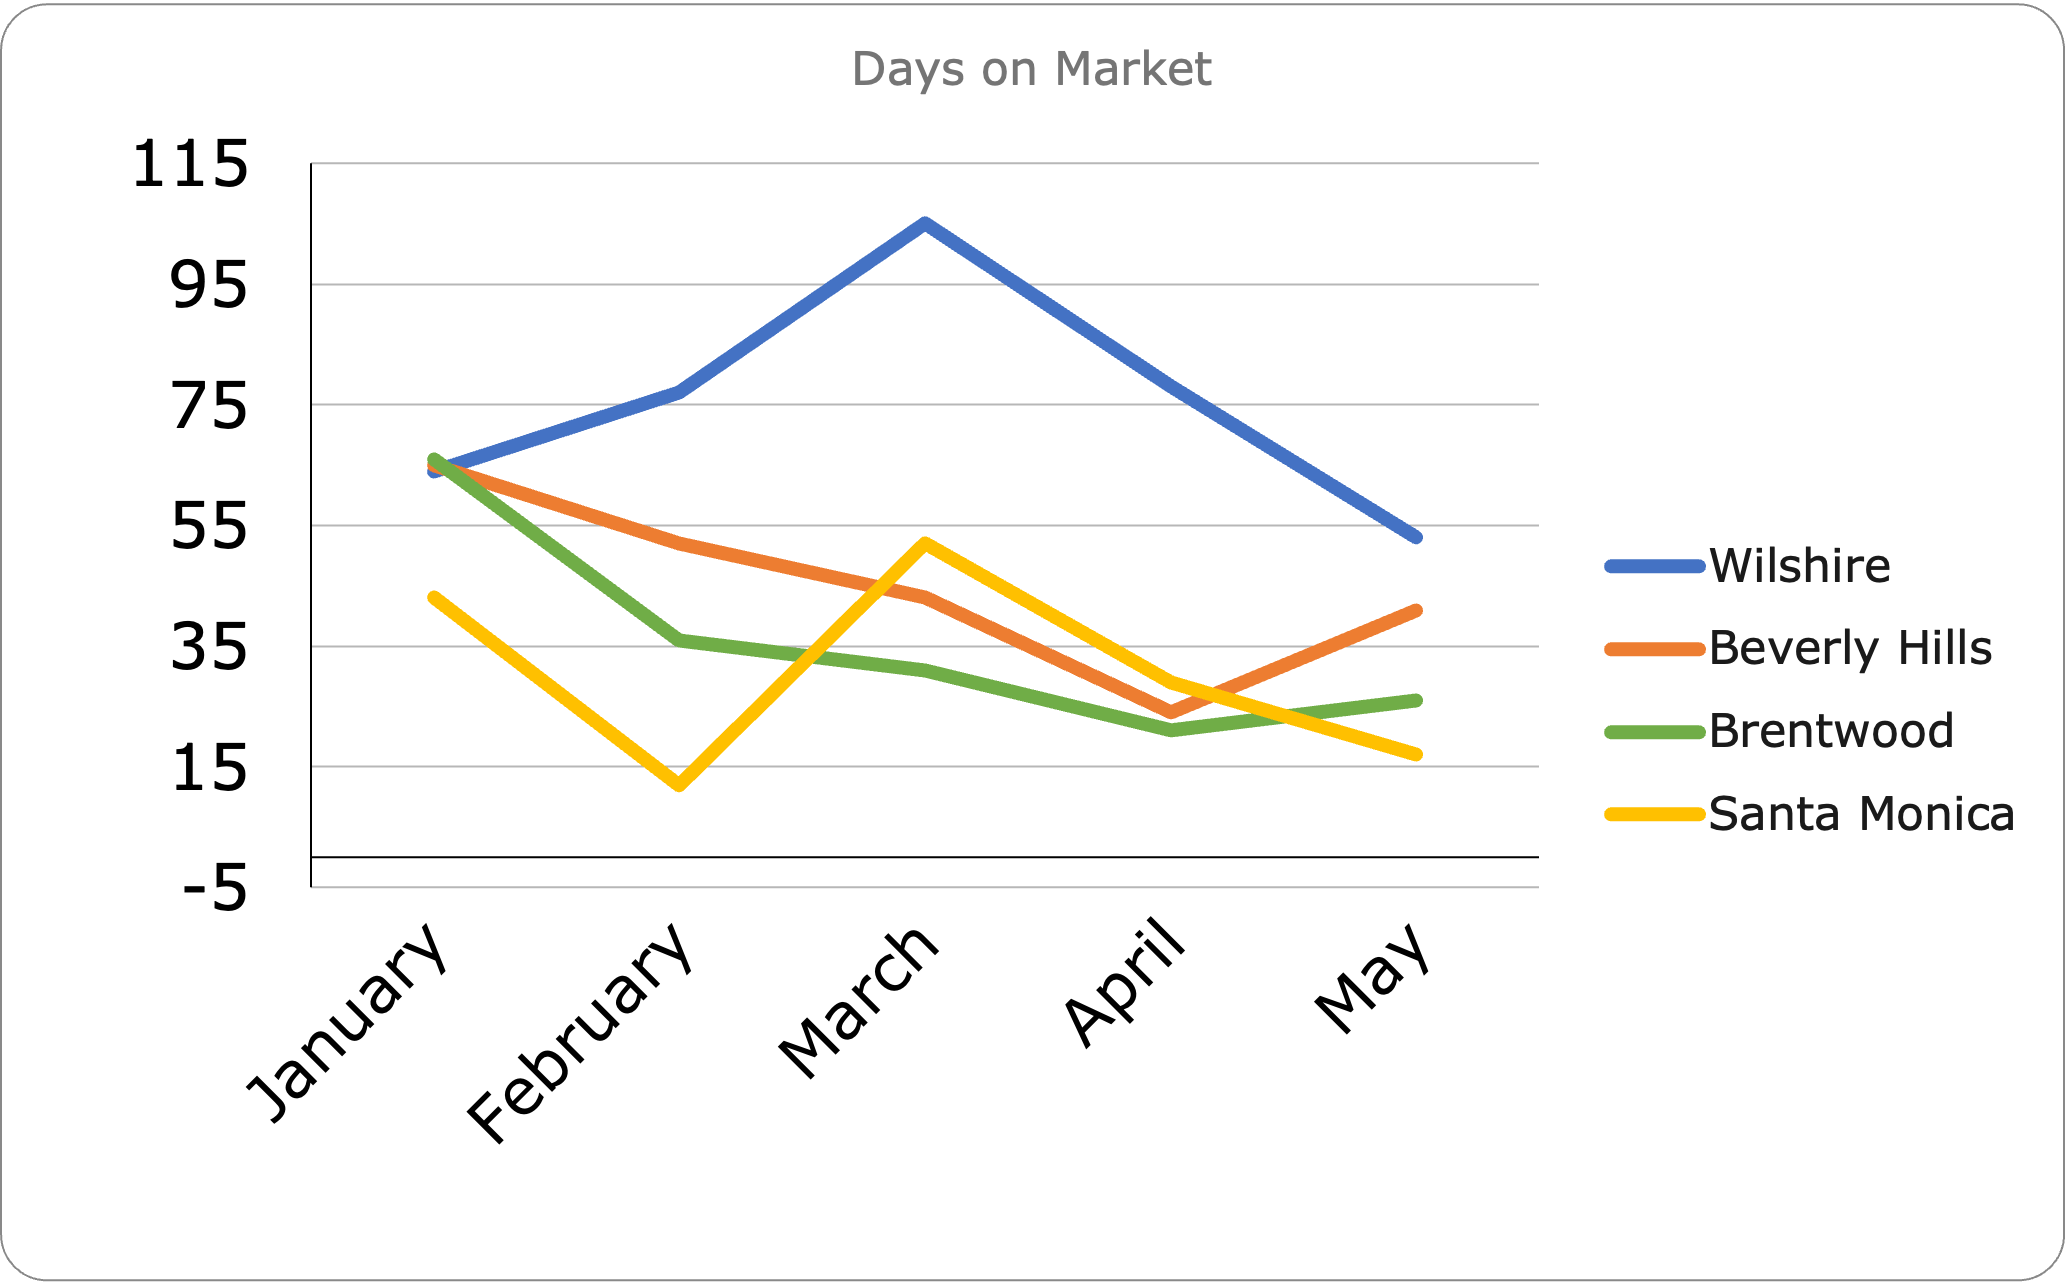
Days on the market remained stable, but $/sq ft rose dramatically in February, topped out in March and April, and then dropped in May. This hump-like trend seems to be something unexpected and appears only in this unique market. I’m surmising that the surge started in the last two months of 2021 with the news of inflation and jumped in January when the feds signaled their intention to raise the rates on fed funds to stem the sharp price increases in food and staples, commonly referred to as the core inflation rate.
Since the Wilshire Corridor primarily attracts seniors who are selling their debt-free homes in return for the added security and community that condominium living provides, most of them are not requiring a mortgage. Thus the decision to garner a high price for their houses before the increase in rates brings about a recession or at the very least reverses the rapid rise in real estate values.
Beverly Hills Condos
You see the opposite in Beverly Hills condos, where the high point of $975.94/sq ft reported for January moves downward in February ($875.44/sq ft) and nose dives in March to $715.02/sq ft, and then reversing to move upward in April and May ($829.33/sq ft and $863.44/sq ft).
You also see similar behavior on the seller’s side. The actual number of condos closing escrow whipsaws all-around from one end to another, six in January, twelve in February, seven in March, fourteen in April, and seventeen in May.
Brentwood Homes
Homes sold in Brentwood remain pretty stable, defying any possibility of aligning themselves with Westwood or Beverly Hills condos. From $1,164.17 in January to $1,344.72 in May, a high of $1,388.07 in February.
Like Beverly Hills condos, their actual unit sales bounced all over the place in those five months, with 19 sold in January, 14 in February, 19 in March, 24 in April, and 29 in May.
Santa Monica
Santa Monica presents an even different picture. Those unit sales shift dramatically between 23 in January and 13 in February, then leveling off to 20 in March and April and settling down to 19 in May. Closed $/Sq Ft figures follow the same trend with a significant increase in February to $1,910.00 from January’s $1,586.33 and then leveling off to $1,579.14 in March, $1,644.87 in April, and $1,635.45 in May.
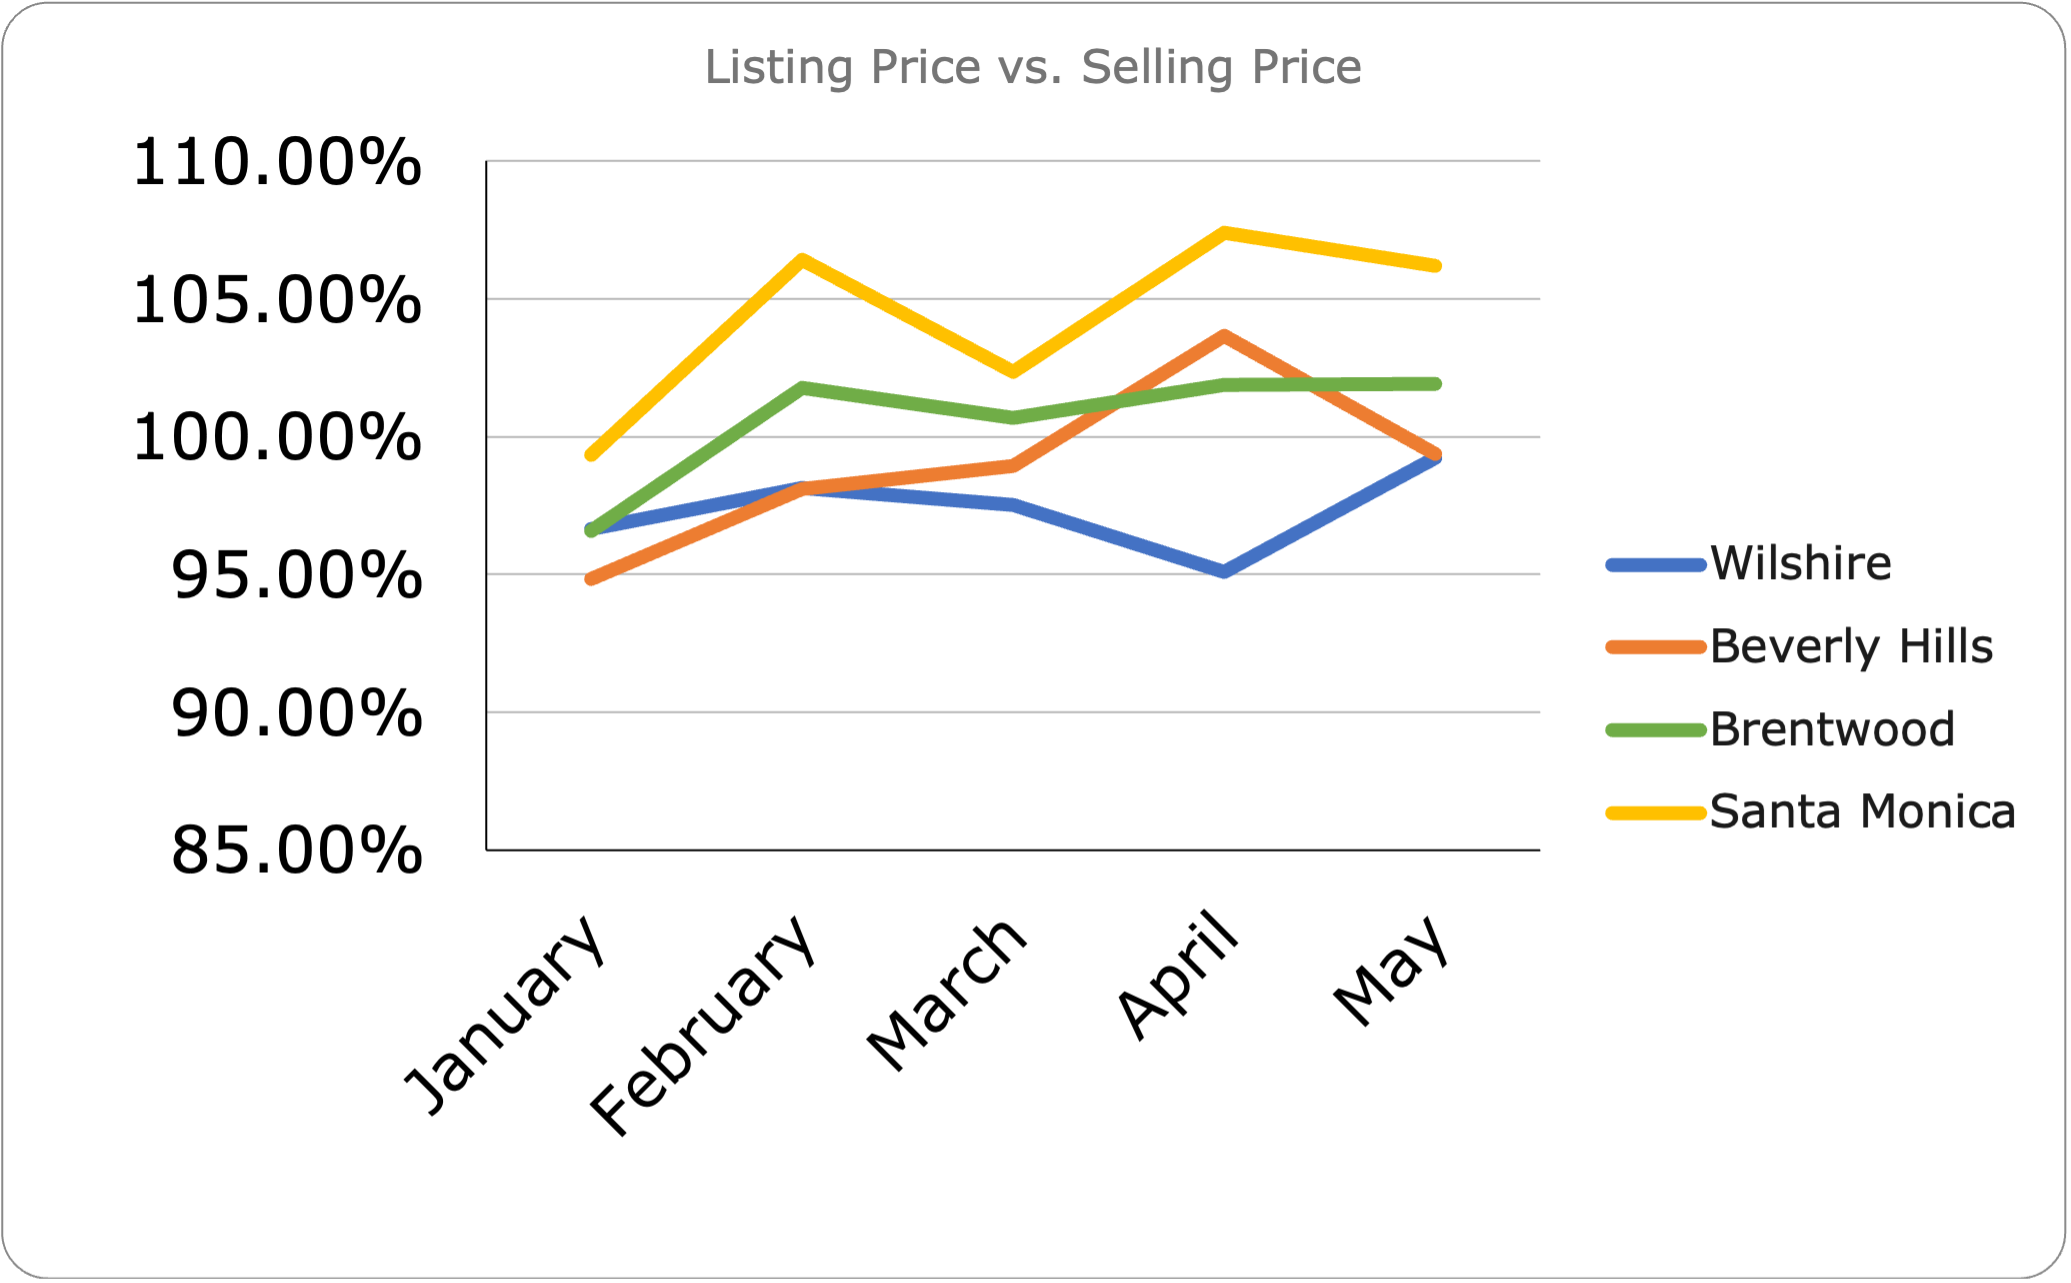
If you want to focus on one set of data points identified as a sign of market pressures, I will submit that it’s the difference between the listing price and the final selling price.
That data shows dramatic shifts in January in three areas; 94.83% in Beverly Hills condos, 96.59% in Brentwood houses, and 99.33% in Santa Monica houses. In addition, Santa Monica and Brentwood houses show an immediate reversal starting in February to the final selling price moving above the listed price.
Condos in Beverly Hills and the Wilshire Corridor show the opposite; almost every month shows continued pressure from the market, forcing sellers to accept offers and close escrows at numbers below their listed prices. I think that what that says is that this reversal of real estate prices will follow past examples; the condos go down first and get hit the hardest, much more so than single-family residences (SFRs).
Once again, the numbers offer the truth. They speak volumes about this market and conditions under which a willing seller will sell, and a willing buyer will buy. There are no common threads for these neighborhoods, and each area will respond to supply and demand.
If you’re a buyer or a seller, don’t try and time the market. Instead, make a good decision based on solid research provided by your agent for the neighborhood you’re looking in. And if your agent doesn’t give you the raw data, find another agent. If you’re unsure about waiting to sell because of what we’re seeing, you can call me for a free pricing audit.
m: 213.280.6415
o: 424.317.6910
Stay positive and test negative. See you next month.
Mark Rogo
Luxury Estates Director
DRE#: 01423795


