Inventory, Measuring Wealth and the Racial Wealth Gap
Two common themes concern many people I talk to about real estate. First, there is the question of why prices have not come down, and the answer is the low inventory on the market. Second, I find it surprising, because people are not sure where they stand in terms of “wealth” (however that is defined) after the economic turmoil of the past three years. The pandemic has arguably changed many people’s net worth statements and retirement strategies.
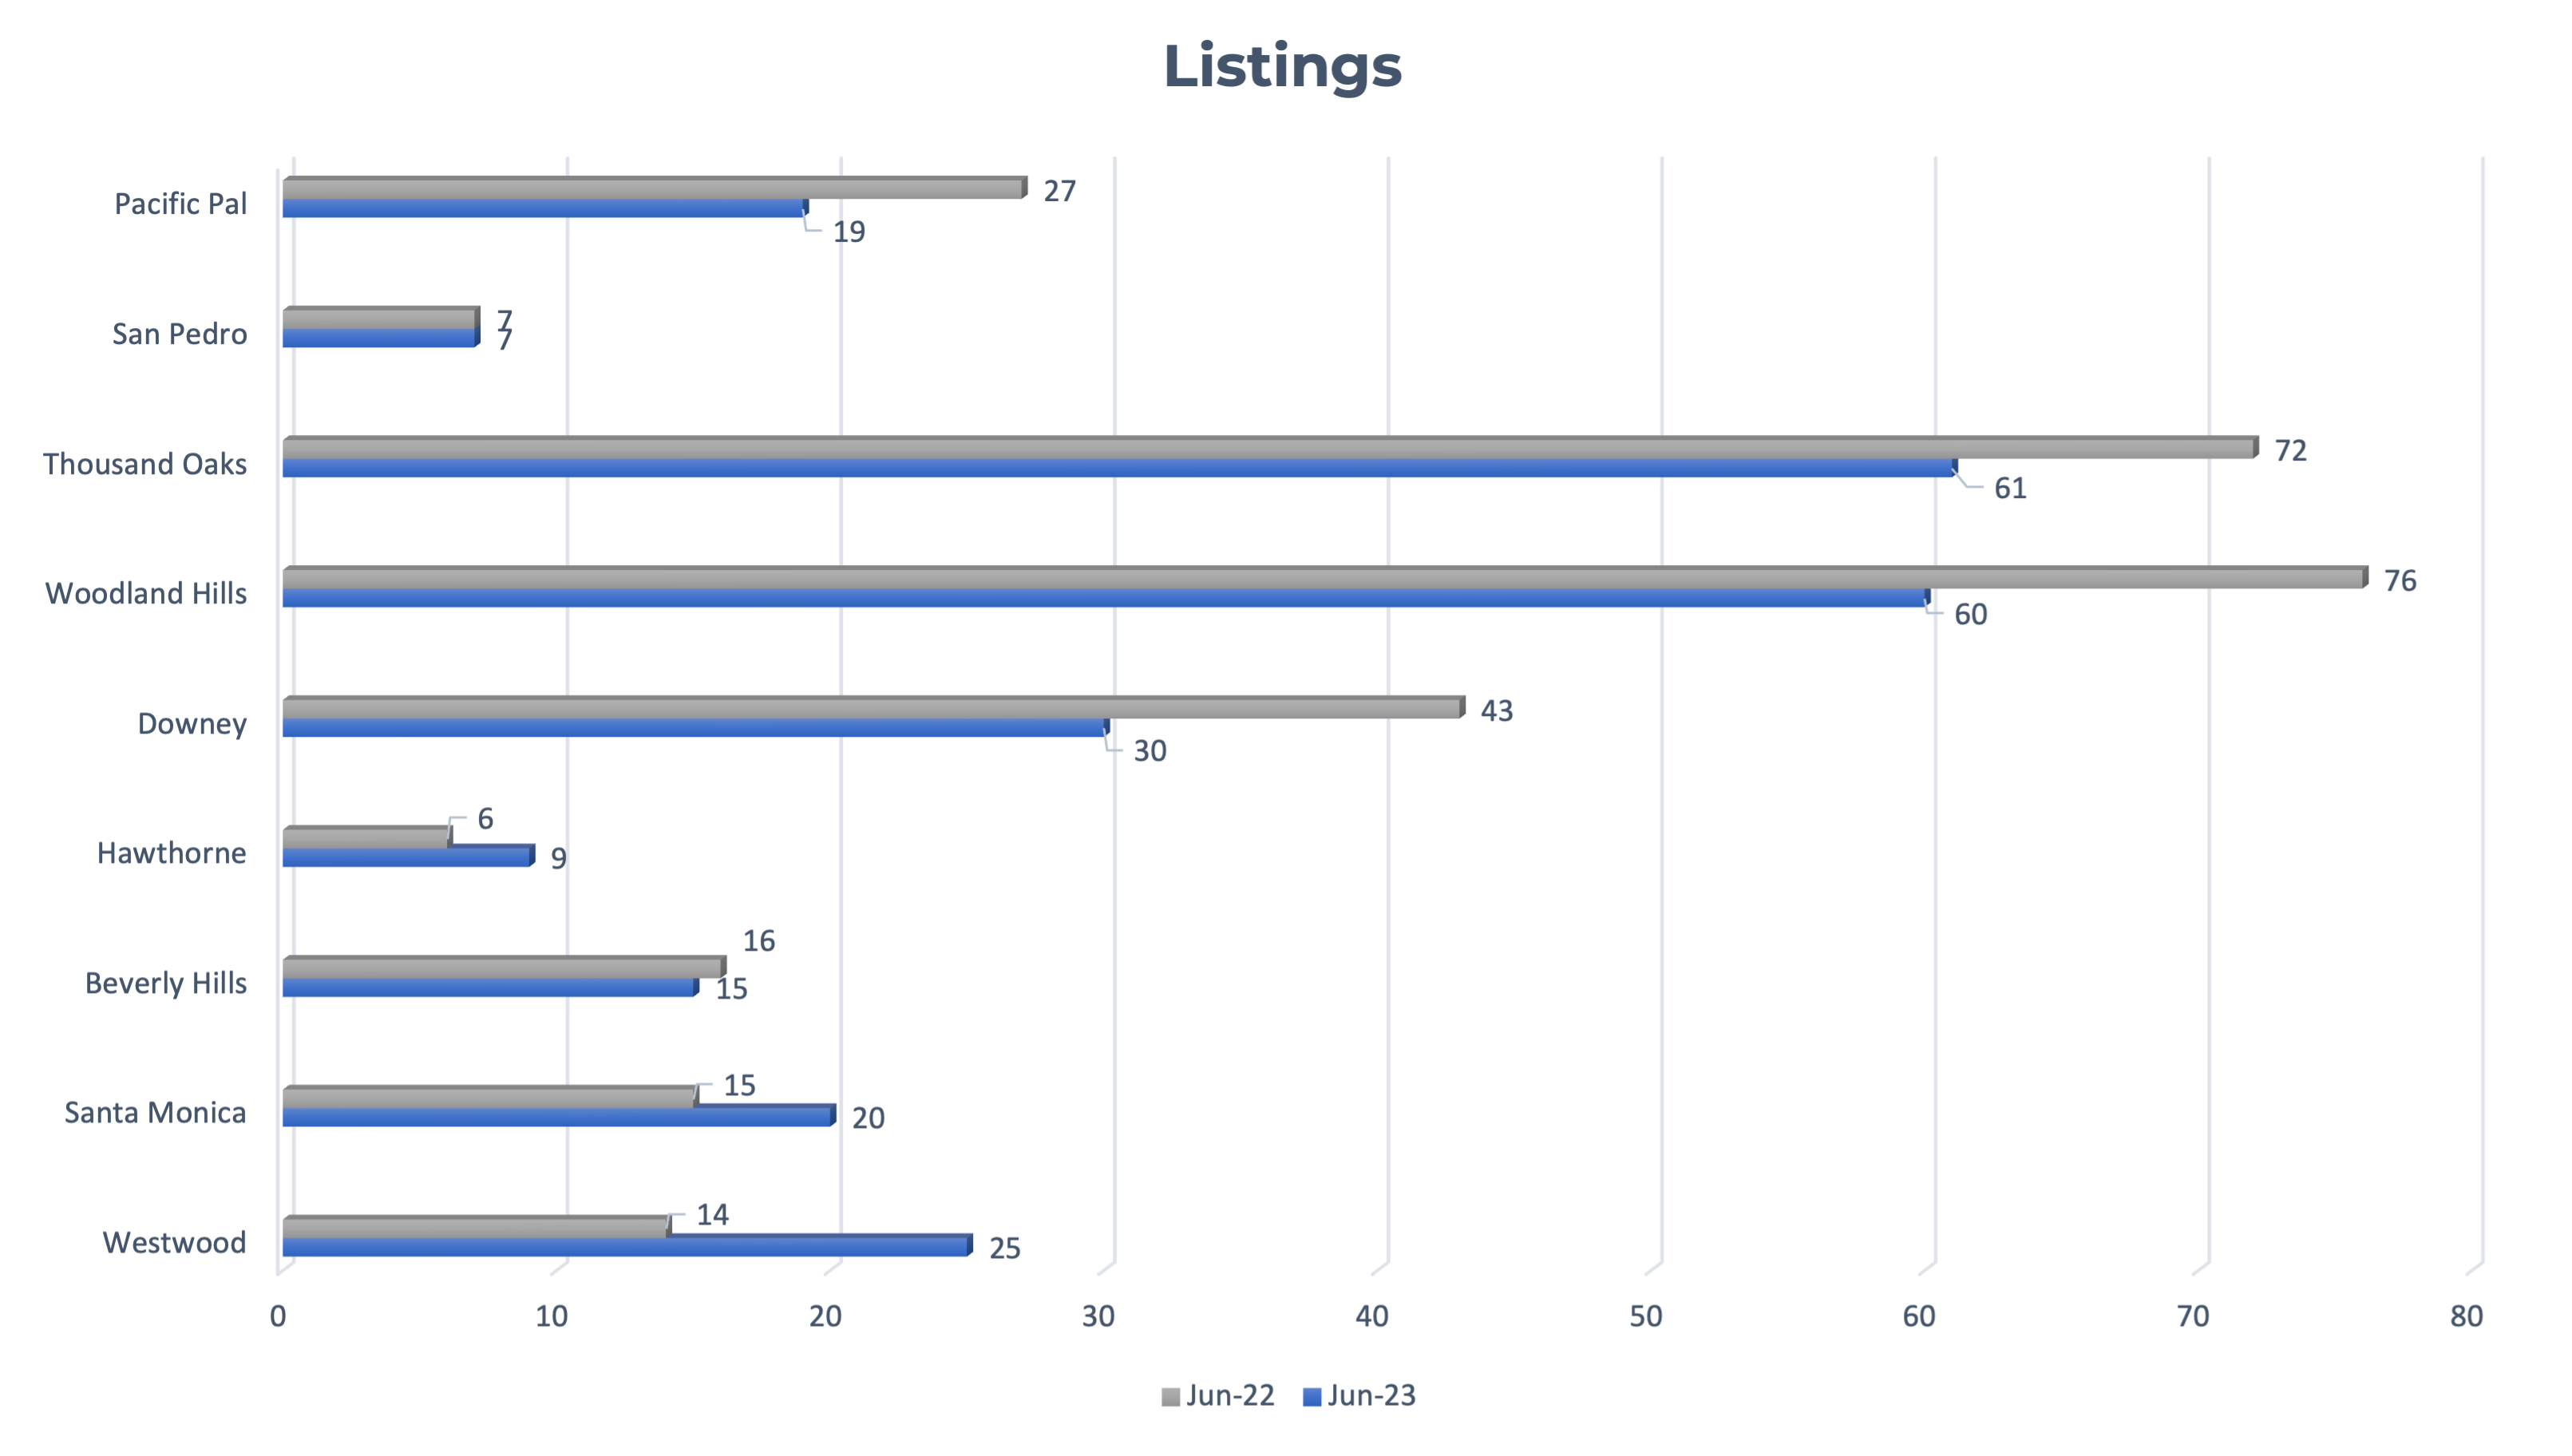
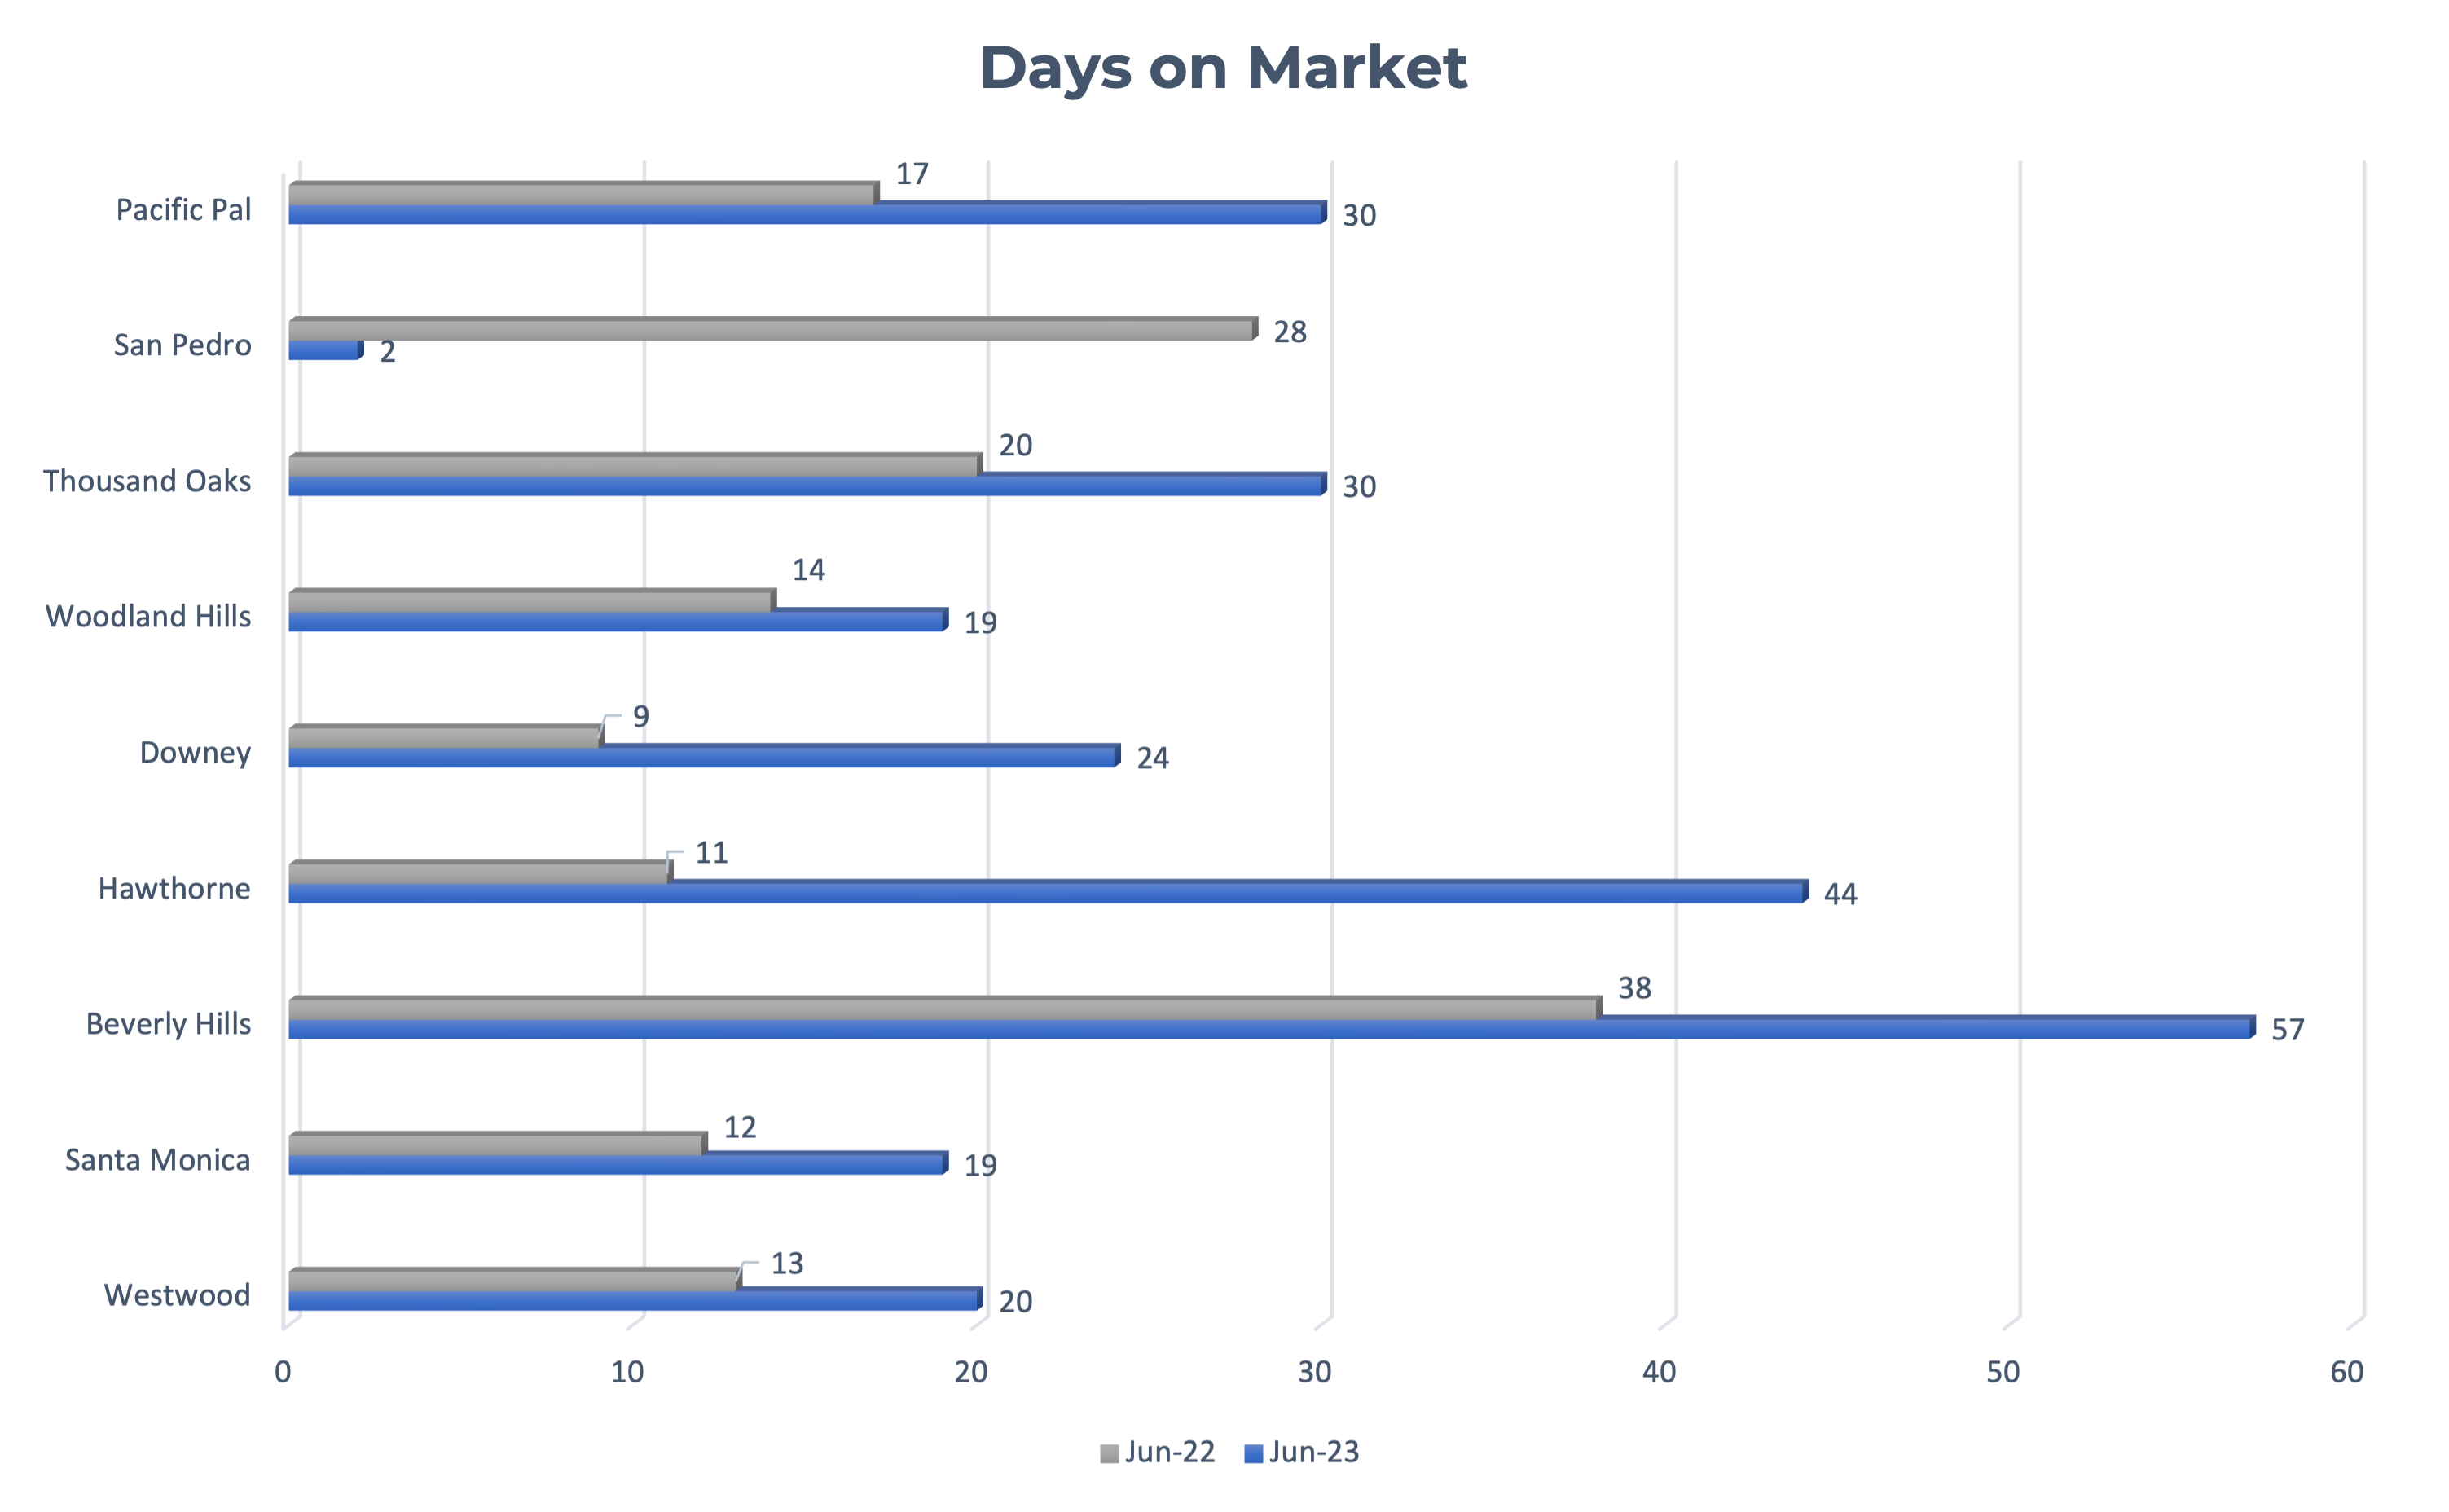
How about the inventory issue first? As shown in the charts below, there is no rhyme or reason why inventory is up or down in different communities. I sampled nine different areas of the greater Los Angeles area, all in different locations and representing different economic strata and median home values. I needed a cross-section, because the numbers initially coming up on the west side did not align with my expectations. This data is pulled from the MLS, representing June 2022 and 2023, Single Family Residence only, and the Number of Listings and Average Days on the Market. (zip code 90024 only for Area 05).
Our Compass sales meetings tell us that inventory remains stubbornly low, which is the primary reason for high home prices even though interest rates have risen. It shows the opposite on the west side, with only Beverly Hills showing a slight decrease in listings from 16 to 15. Westwood shoots up from 14 to 25 and Santa Monica 15 to 20.
But look at these other areas more in line with the rest of the country. Woodland Hills is down 76 in 2022 to 60 listings in 2023. Downey is 43 to 30, and Thousand Oaks is 72 to 61. Only Hawthorne rose from 6 to 9.


o
We can extrapolate some basics to provide some explanation, but I’m on very thin ice here. I would guess that a higher percentage of the closed sales on the westside are all cash, and thus not directly affected by interest rate hikes. Also that the normal reasons to sell a home, such as a divorce, death, or job transfer, apply less on the west side, where many homes are part of estate portfolios and estate planning comes into play. Many homeowners would like to sell but can’t afford to give up their 2% and 3% mortgages, so they stay where they are. None of these factors is anything more than conjecture on my part, and all of it points to the fickle behavior of sellers in this marketplace.
But now carefully examine the Days on Market graph. (I just love this stuff). Almost every community has a distinct rise in the days on market, and by significant amounts. Every day a homeowner still owns his home is another day of property taxes, insurance, mortgage, repairs, and aggravating open houses and showings. Yet, these homes took longer to sell, or more likely. The sellers took longer to deal with an aggressive buyer’s market. In any case, I’m willing to bet if I wanted to dig deeper and trend-line the data every month along with % the difference between listing and selling price, I would see that the sellers are exhibiting a certain amount of frustration to get the price they have in mind, which is becoming a fleeting memory in a market under pressure to decline.
At some point, the sellers must cave into the pressure and recognize the power of the market gods. What will happen? If there is more inventory on the market, giving buyers more choices, the cliff’s precipitous edge will be steep and we will see a sharp decline in gross sales as measured by $/SqFt. But if inventory remains stubbornly low, that drop off the cliff won’t be drastic, and instead become a slow slide.
Now, to the question of wealth adjustment. The past four years have been a nightmare for many affected by the pandemic. Small businesses took a hit; many jobs disappeared, there was a disruption in how we work and where we work, and over 9,000,000 Americans died, which has an ancillary effect on the real estate market with the homes of the deceased that need to be sold. Lynn and I have heard personal stories from our clients, expressing all these reasons, and our hearts were broken. This has not been a happy time for many people, including me, with my mother’s passing, and I believe her demise was pushed by being infected with the virus.
For many of our clients, the question was not about the real estate issue at hand; it was more about what effect this unexpected event played in their plans to retire. Can they retire? Can they retire with dignity? Can they afford to retire and stay in their home, or do they need to move out of state? Will they be able to afford any unexpected medical issues?
These aren’t questions for me; I referred them over to my estate attorney. But when you hear it enough times, you start searching for answers for your friends. None of us knows what lies ahead, but we do have a better sense of our abilities to meet those challenges if we know where we are in the rankings. I have found that most of my discussions with friends and clients ended when I could dispel their concerns with actual data showing them they had the assets to tackle the unknown.
So I went digging. I’m not going to bore you with all of the articles and data I poured through, but if you feel compelled, start here with FRED (Federal Reserve Economic Data). A little overwhelming, but an amazing treasure trove of data on all phases of our lives. I love reading through this in the evenings when I have the time.
Where do you stand as measured by net worth:
- People with the top 1% of net worth in the U.S. in 2022 had $10,815,000 in (minimum) net worth.
- The top 2% had a (minimum) net worth of $2,472,000.
- The top 5% had $1,030,000.
- The top 10% had $854,000.
- The top 50% had $522,210.
What is the average net worth by age, as measured in 2019:
- Younger than 35 $76,300
- 35 – 44 $436,200
- 45 – 54 $833,200
- 55 – 64 $1,175,900
- 65 – 74 $1,217,700
- 75 or older $977,600
The best single article that provided focused links was by Kiplinger in an article titled “Are you Rich; U.S. Wealth Percentiles Might Provide Answers”. They have a simple calculator that will tell you what % bracket you are in, as measured by net worth. That will help you understand your position in society and help you get a perspective on your retirement plans. There are also links for additional articles on retirement strategies and small things you can do to ensure your financial security.
But there is more. We all know that bigotry and racism have been a huge reason for the economic divide between the white, black, and brown communities. I thought a lot of that had been dissipated through the passage of the 1965 Civil Rights Act and the enforcement of laws prohibiting discrimination in the housing market. Well, my friends, not so. And not so in a big way.
The “Racial Wealth Gap,” as it’s called, is alive and well in America. Kiplinger says, “Housing equity makes up about two-thirds of all wealth”, and when racism enters the picture, and discriminatory behavior is practiced, the black and brown communities suffer. “White families’ median wealth was $188,200, while Black families’ was less than 15% of that of whites’ at $24,100. Hispanic families’ median wealth was $36,100.” There is no reason in the world for these disparities to exist. The U.S. Dept. of the Treasury documents this problem in an article published in September of 2022, “Racial Differences in Economic Security: The Racial Wealth Gap”.
I’ve been told not to get political in the blog, but this issue just gets under my skin. Real estate agents are required by federal law to practice non-discriminatory behavior and to require their clients to do the same. Yet here it is, data pointing to a persistent practice of racism in this country in the housing market.
Finally, I want to remind my readers that we can assist you with your real estate needs. While we are licensed for residential real estate in California, we continually receive inquiries about listing income properties and commercial properties from our clients, or selling or buying residential properties out of state. We are always happy to take a few moments and make the call to the manager of the local Compass office and get the proper agent referred over. We know what questions to ask and how to interview the agent. It will always give you a better result than just leafing through the internet and taking a stab at it. Just this past week we referred the right commercial agent on two medical buildings owned by our past client, and reviewed the listing agreement for them.
Be well, stay positive, and test negative.
— Mark Rogo


